

How to setup Prometheus and Grafana to monitor ( Part1)
What is Prometheus and Grafana ?


1. What is Prometheus?
 One of the useful tools that I use for monitoring servers is Prometheus - An Opensource Time Series Database. This article is for those of you who are learning about Prometheus, with the aim of helping you quickly understand how Prometheus works, how to install and configure prometheus before turning the metrics (metrics). Now let's learn about it!
How Prometheus works:
Prometheus will actively pull (pull) metrics over HTTP every 10s or 30s set by us. Services themselves often cannot export metrics to Prometheus, but need Instructmentation/Exporter. These two concepts have the same purpose, but can be temporarily understood as follows:
- Exporters are applications written for common things like Database, Server. We just need to run it and it will export the collected metrics for us.
- Instructmentation refers to the client-libraries provided by Prometheus or a third party, for me to install in my application, helping to customize the system's own metrics. Like the number of people who have logged into your website every hour, for example.
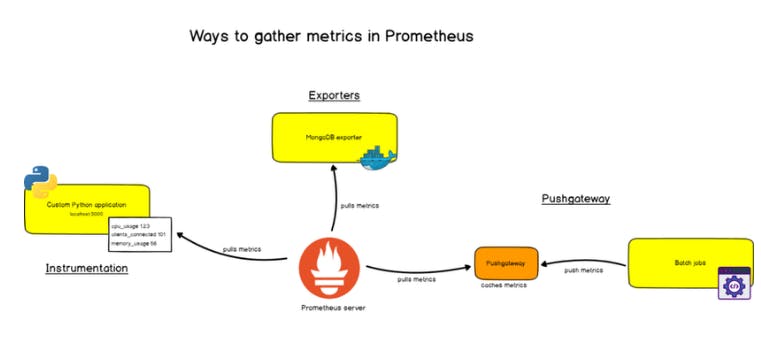
Some exporters:
- Prometheus: prometheus itself also has a built-in exporter, which exports service prometheus metrics at the URI: prometheus.lc:9090/metrics.
- cAdvisor: export metrics of docker services, processes on the server.
- Node Exporter: export metrics for a node (understood as a server) such as the node's CPU, RAM, disk space, number of requests to that node, .etc.
- Postgres Exporter, which reads data from Postgres tables and exports it to Prometheus.
- HAProxy Exporter
2. What is Grafana ?
- Grafana is an opensource dashboard/dashboard that supports a wide variety of dashboards and graphs for administrators to easily monitor.
- Grafana can retrieve data from Graphite, Elasticsearch, OpenTSDB, Prometheus, and InfluxDB. Grafana is a powerful tool for retrieving and representing data in the form of graphs and charts.
References: Prometheus and Grafana
Write up by Fr0st