Task 1: Introduction to Splunk
Typically when people think of a SIEM, they think of Splunk, and rightly so. Per the Splunk website, they boast that 91 of the Fortune 100 use Splunk.
Splunk is not only used for security; it's used for data analysis, DevOps, etc. But before speaking more on Splunk, what is a SIEM exactly?
A SIEM (Security Information and Event Management) is a software solution that provides a central location to collect log data from multiple sources within your environment. This data is aggregated and normalized, which can then be queried by an analyst.
As stated by Varonis, there are 3 critical capabilities for a SIEM:
- Threat detection
- Investigation
- Time to respond
Some other SIEM features:
- Basic security monitoring
- Advanced threat detection
- Forensics & incident response
- Log collection
- Normalization
- Notifications and alerts
- Security incident detection
- Threat response workflow
This room is a general overview of Splunk and its core features. Having experience with Splunk will help your resume stick out from the rest.
Splunk was named a "Leader" in Gartner's 2020 Magic Quadrant for Security Information and Event Management.
Per Gartner, "Thousands of organizations around the world use Splunk as their SIEM for security monitoring, advanced threat detection, incident investigation and forensics, incident response, SOC automation and a wide range of security analytics and operations use cases."
Task 2: Navigating Splunk
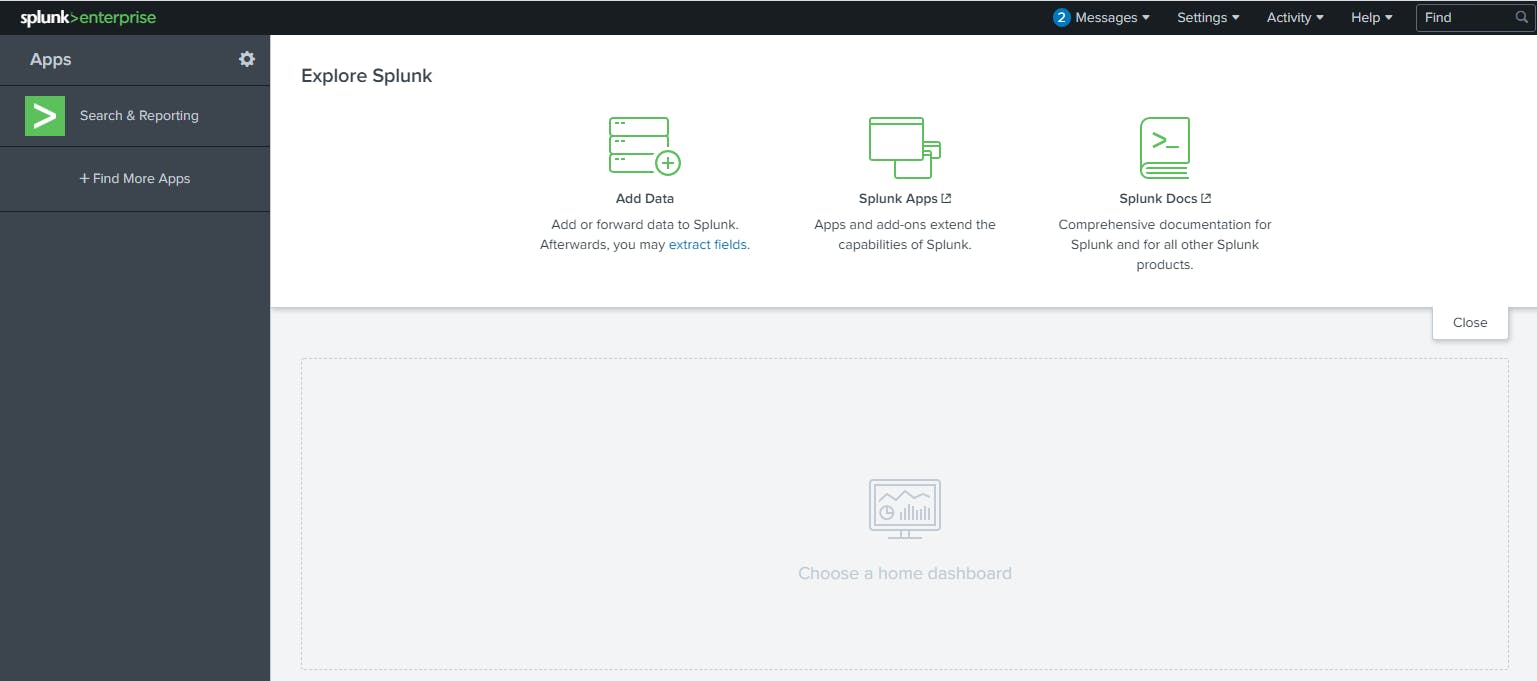
When you access Splunk, you will see the default home screen identical to the screenshot below.
 Let's look at each section, or panel, that makes up the home screen. The top panel is the Splunk Bar (below image).
 In the Splunk Bar, you can see system-level messages (Messages), configure the Splunk instance (Settings), review the progress of jobs (Activity), miscellaneous information such as tutorials (Help), and a search feature (Find).
The ability to switch between installed Splunk apps instead of using the Apps panel can be achieved from the Splunk Bar, like in the image below.
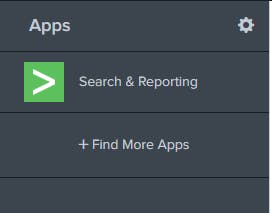
 Next is the Apps Panel. In this panel, you can see the apps installed for the Splunk instance.
The default app for every Splunk installation is Search & Reporting.
 The next section is Explore Splunk. This panel contains quick links to add data to the Splunk instance, add new Splunk apps, and access the Splunk documentation.
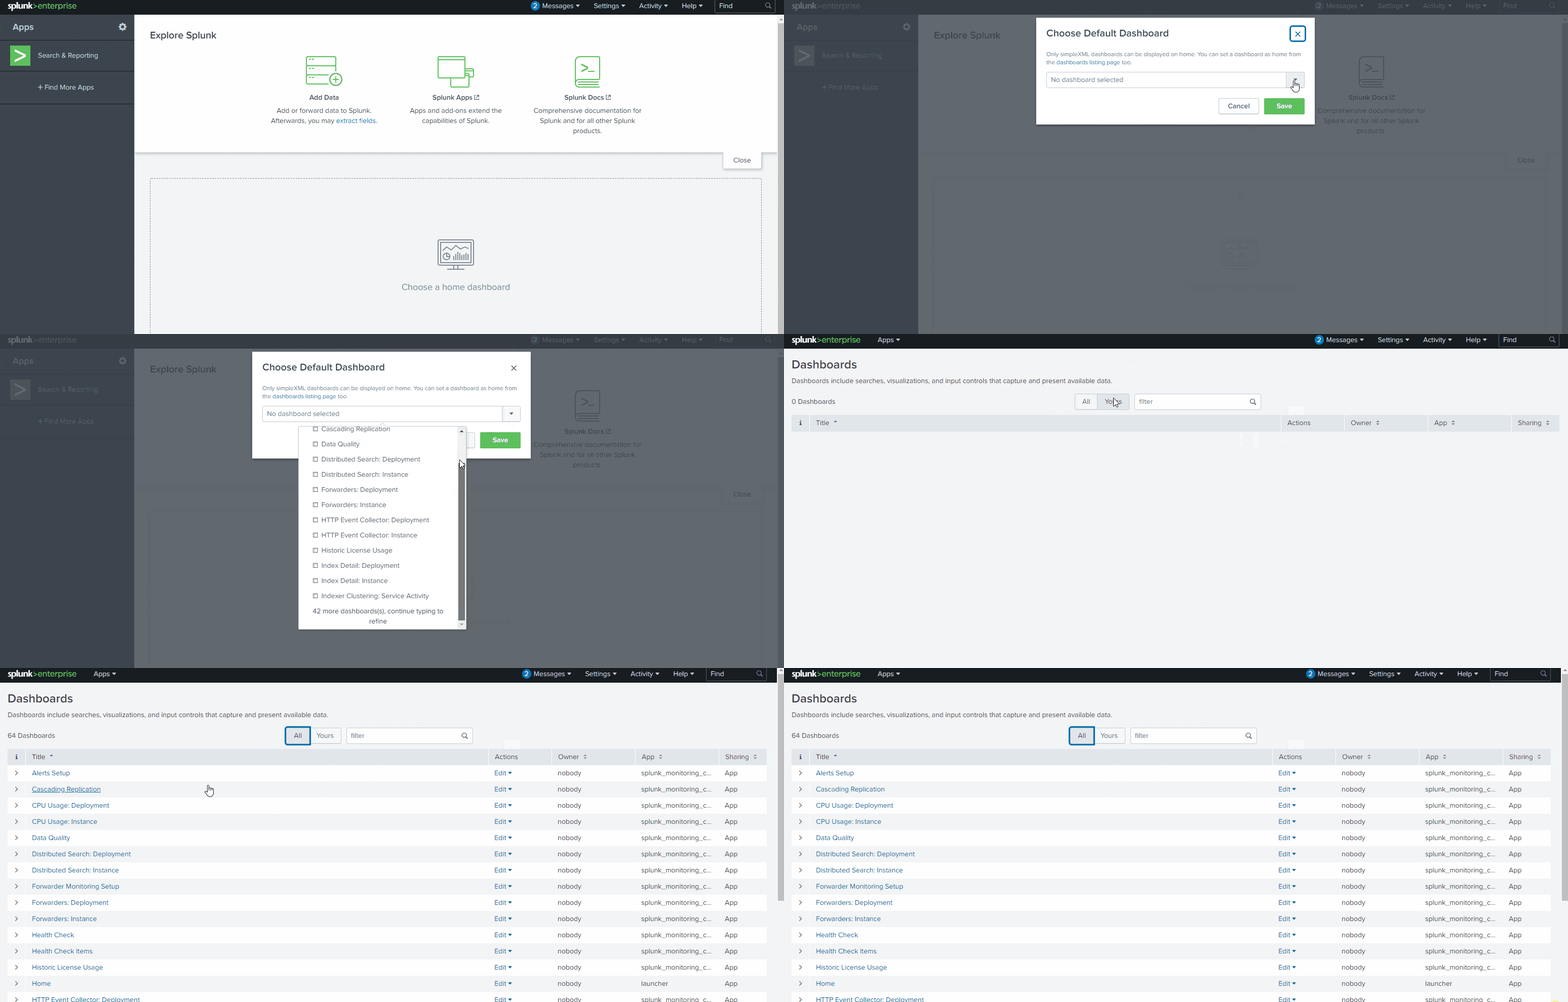
 The last section is the Home Dashboard. By default, no dashboards are displayed. You can choose from a range of dashboards readily available within your Splunk instance. You can select a dashboard from the dropdown menu or by visiting the dashboards listing page.
 You can also create dashboards and add them to the Home Dashboard. The dashboards you create can be viewed isolated from the other dashboards by clicking on the Yours tab.
